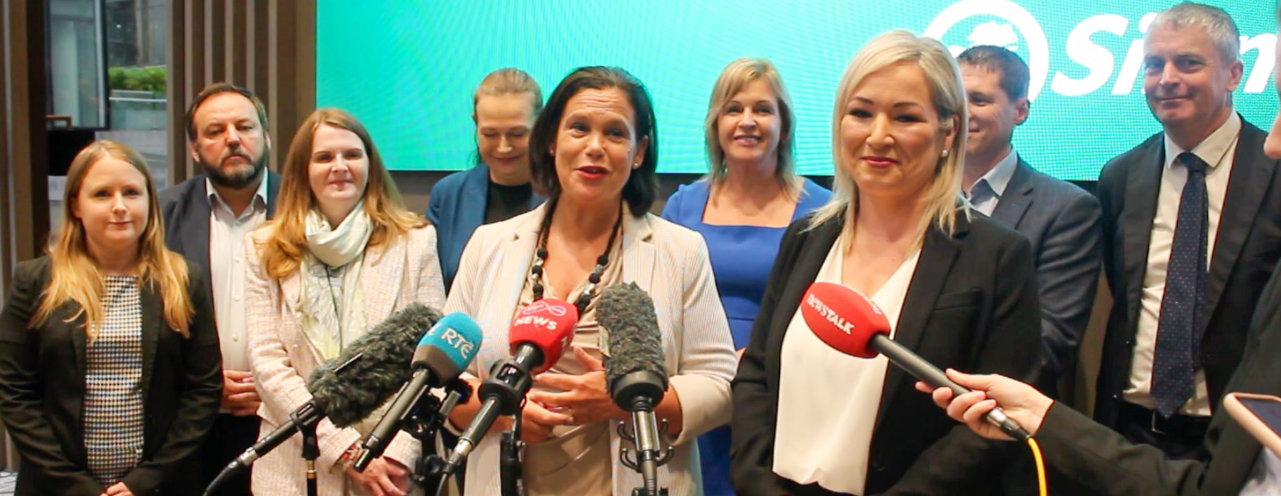
The Dublin Mid-West TD’s comments were made at the latest MyHome.ie report in association with the Bank of Ireland showed house price inflation accelerating.
Teachta Ó Broin said:
“The latest report from MyHome.ie and Bank of Ireland showing house price inflation is running at 6.5% and the rate of increase is accelerating is very worrying but not surprising.
“Government housing policy is pushing up house prices. The combination of low affordable housing output, stagnant private for purchase output and demand side subsidies like the so-called Help to Buy Scheme and the high risk Shared Equity Loan scheme mean that the gap between supply and demand continues to grow.
“Independent analysis from TUD Dublin housing economist Lorcan Sirr has shown that despite an increase in overall supply of new homes, the number of new homes coming to market for owner occupiers is stagnant in real terms. It is also concerning that the number of homes for sale on the open market as a percentage of overall output has fallen to just 27%.
“Meanwhile, the government missed all of their affordable housing targets last year. They missed their affordable purchase home target by 62%, their cost rental target by 59%, their First Home Scheme by 44% and their vacant property refurbishment grant target by 83%.
“Whether it is affordable purchase homes or private purchase homes, the government’s housing plan is simply not working. Low supply coupled with increased developer subsidies will simply drive house prices further upwards.
“This is yet more evidence as to why we don’t need Simon Harris to be elected Taoiseach tomorrow. We need a general election, a change of government and a new housing plan that focuses on the delivery of tens of thousands of affordable homes at prices working people can afford.”
TUD Dublin Lorcan Sirr analysis of stamp duty transactions:
| Year | Total new residential completions by year | Sold to owner occupiers | Sold homes as % of total completions | Sold apartments as % of total apartment completions | Sold houses as a % of total house completions |
| 2017 | 14,267 | 7,312 | 51% | 37% | 82% |
| 2018 | 17,861 | 8,538 | 48% | 38% | 70% |
| 2019 | 21,097 | 8,679 | 41% | 21% | 63% |
| 2020 | 20,533 | 7,092 | 35% | 11% | 56% |
| 2021 | 20,516 | 7,549 | 36% | 11% | 65% |
| 2022 | 29,716 | 9,049 | 30% | 6% | 55% |
| 2023 | 32,695 | 8,911 | 27% | 7% | 52% |


